
Intro
Wayne Szalinski did not mean to shrink his kids. He was tinkering with a machine in the attic, a baseball came through the window at exactly the wrong moment, and suddenly four children were the size of a grain of rice and lost somewhere in the backyard. The entire rest of the movie is the family crawling through the grass on their hands and knees, hunting for something that was never actually gone. It was just very small, and in a place nobody thought to look.
I bring this up because that is almost exactly what it feels like to chase the Replication slice in FlashArray capacity reporting.
A customer emailed me a couple weeks back. Their array had started filling up over a weekend and the growth was all in that yellow “Replication” band on the dashboard. I looked, and sure enough they had promoted a couple of ActiveDR target pods for a DR test and never demoted them. Easy answer, right? Demote the pods and you’ll get the space back. I sent that reply feeling pretty good about myself.
Then they demoted, and wrote back saying that the space was still being consumed.
Fortunately, after 24 hours the capacity was released back into the pool. But it spiked my dopamine, inspiring me to build a scenario in the lab. So let’s build the thing and watch it happen. I promoted a pod, dumped 800GiB of deliberately awful data through it, demoted, and then chased the capacity through three different buckets over the course of a week before it actually came back. Here’s the whole hunt.
First, What Is “Replication” Space?
Starting in Purity 6, the GUI, CLI and REST API all report a capacity category called Replication. Here’s the official line from the ActiveDR FAQ:
Replication space is capacity associated with either of the ActiveDR or ActiveCluster pod based replication features. Replication space includes the capacity used to maintain replication while ActiveDR target pods are promoted for testing or for failover.
And the best practices guide is refreshingly direct:
Avoid leaving the replication target pod promoted for long periods of time. Leaving the target pod promoted while production is running will gradually lead to Replication Space increasing.
So the short version is: it’s the cost of holding two truths at once. Normally your ActiveDR target pod is demoted and read-only, quietly following the source. Promote it (for a fire drill, or a real failover) and it forks. It becomes its own writable thing. But the source pod is still running and still shipping changes across the wire, and the target array still has to catch and keep all of that in the hidden tracking pod.
Now the target array is on the hook for two versions of reality: the promoted copy your DR test is looking at, and the ever-growing stream of new stuff arriving from production. That gap is Replication space. The docs describe the cost as roughly equivalent to holding a snapshot for the same window, which turns out to be a very good mental model.
That’s the theory. I wanted numbers.
What You’ll Need (My Rig)
- Two FlashArrays running Purity 6.10.6 (mine were an //X90 pair, 57.08T usable each). Source was
sn1-x90r2-f06-27, target wassn1-x90r2-f06-33. - An ActiveDR pod pair with a healthy replica link. Mine was
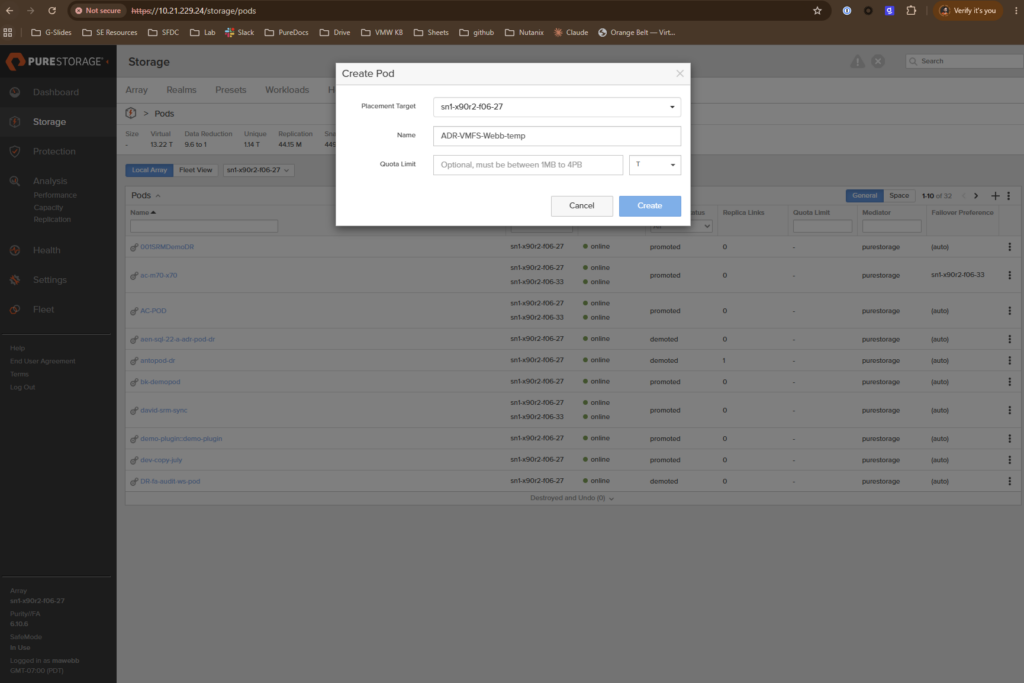
ADR-VMFS-Webb-tempreplicating toADR-VMFS-Webb-temp-dest. - A 10T volume in the pod, presented to vSphere as a VMFS datastore (
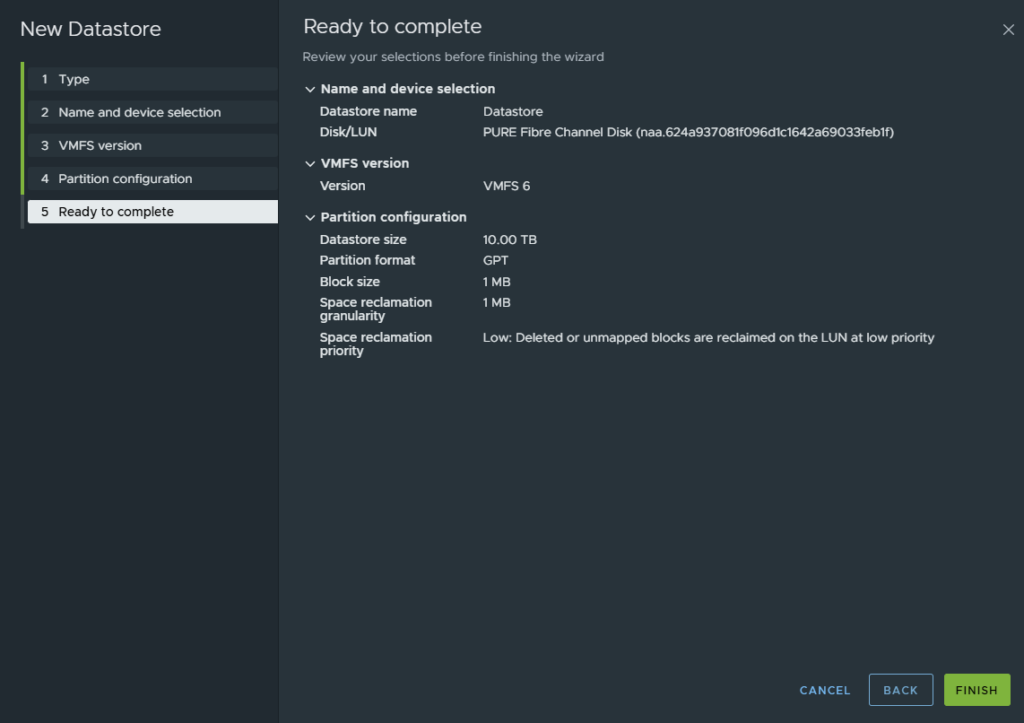
adr-vmfs-webb-vc01). - Four Ubuntu VMs living on that datastore, each with a 500GB thin disk added just for this.
- Plenty of headroom. This matters. I started at 36.1% used on the source and 28.2% on the target, which gave me room to be reckless. The best practices guide says to keep arrays under 80% before enabling ActiveDR at all, so don’t run this experiment on a full array.
A note on the data I used
I had an AI write 200GiB per VM as 200 individual 1GiB files, and every single file is an AES-CTR keystream keyed on a hash of the hostname, a generation number, and the file index.
The data is incompressible and globally unique. It will not compress, it will not dedupe against itself, it will not dedupe across the four VMs, and when I overwrite a file with a new generation number, the replacement bytes have never existed on the array before.
That is not a realistic workload. It is a deliberate worst case, and I picked it on purpose. If I’d written zeroes or copied the same ISO around, Purity may have showed different graphs reflecting datareduction skewing the test. Unique data makes it easier to track what we want to see, which is how replicated data is tracked when we have a promoted pod.
Step 1: Baseline. Steady State ActiveDR Is Free.
800GiB replicated across, the link settled back to replicating after it had a burst of a sync.
| source f06-27 | target f06-33 | |
|---|---|---|
| Pod unique | 809.13 G | 808.33 G |
| Promotion | promoted | demoted |
| Replication | 0.00 G | 0.08 G |
Zero. Or near enough that 0.08G is rounding error on a 57T array.
This is worth pausing on, because it’s the control for everything that follows. ActiveDR replicating happily to a demoted target, even after shoving 800GiB through it, costs you nothing in Replication space.
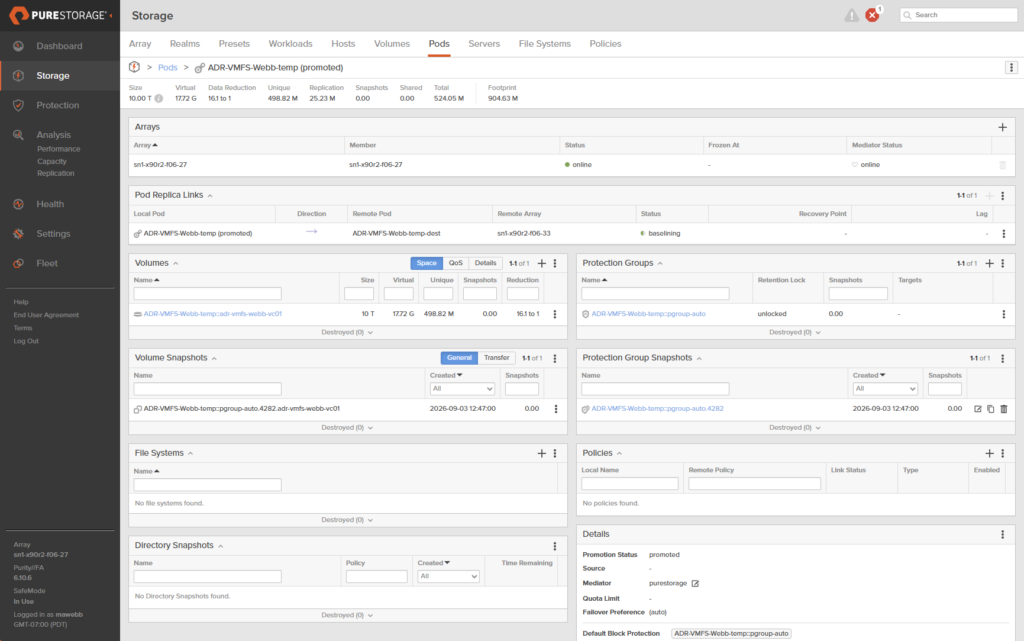
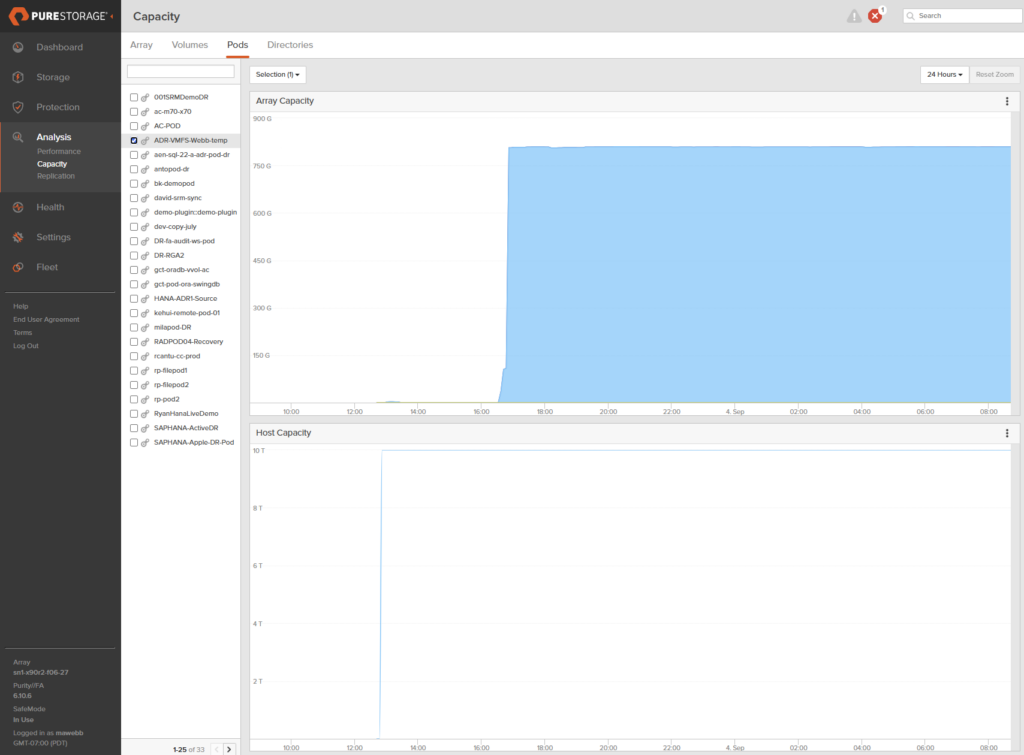
A peek at the source pod:
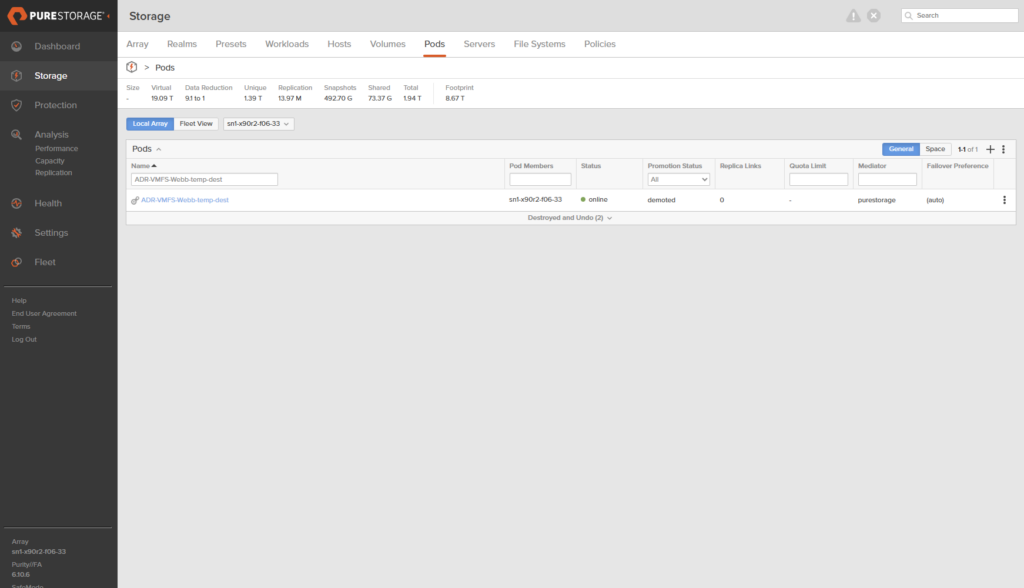
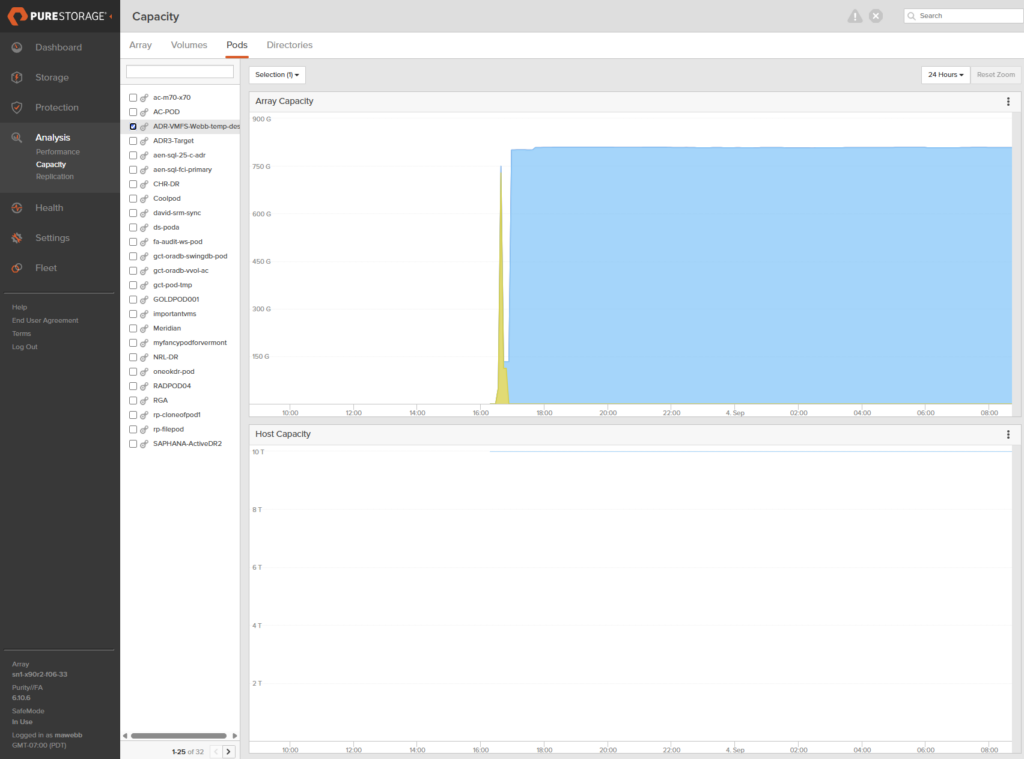
A peek at the destination pod:
Step 2: Promote. Also Free!
Promotion by itself costs you nothing. The pod forks, the DR copy goes read-write, and the meter does not move. I had assumed there’d be some immediate cost to standing up a second copy, and there isn’t.
So it’s not “promoting is expensive.” It’s “promoting and then letting production keep changing is expensive.” Those are different sentences and the difference is your change rate. A promoted target pod attached to a completely idle source would sit there costing you approximately nothing indefinitely.
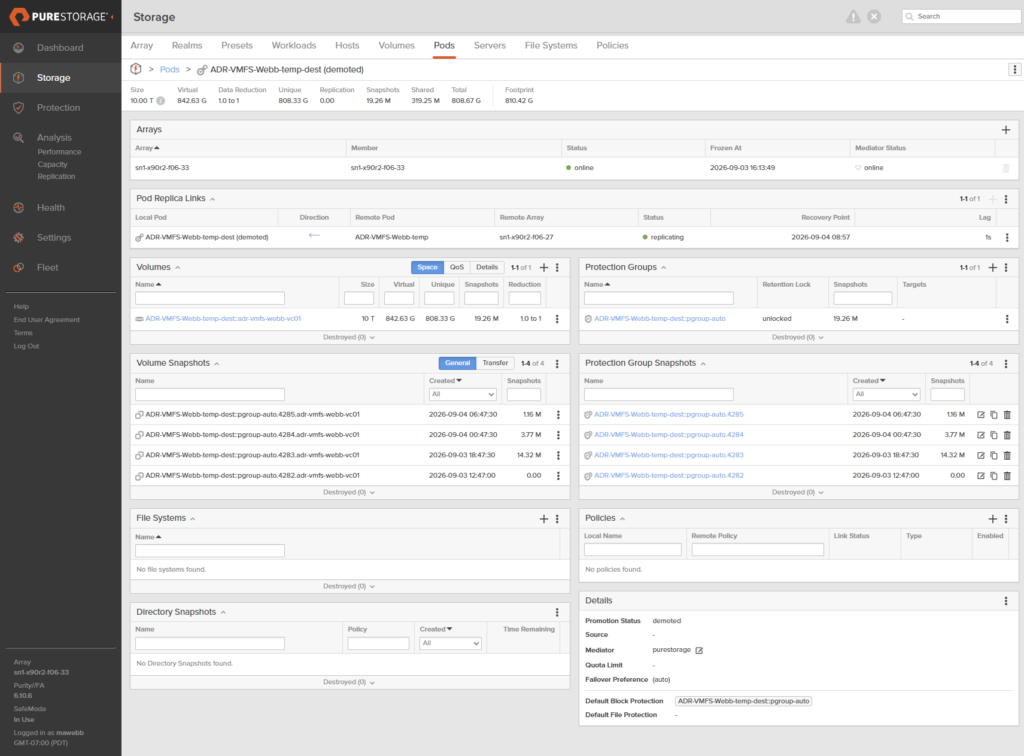
Demoted dest pod:
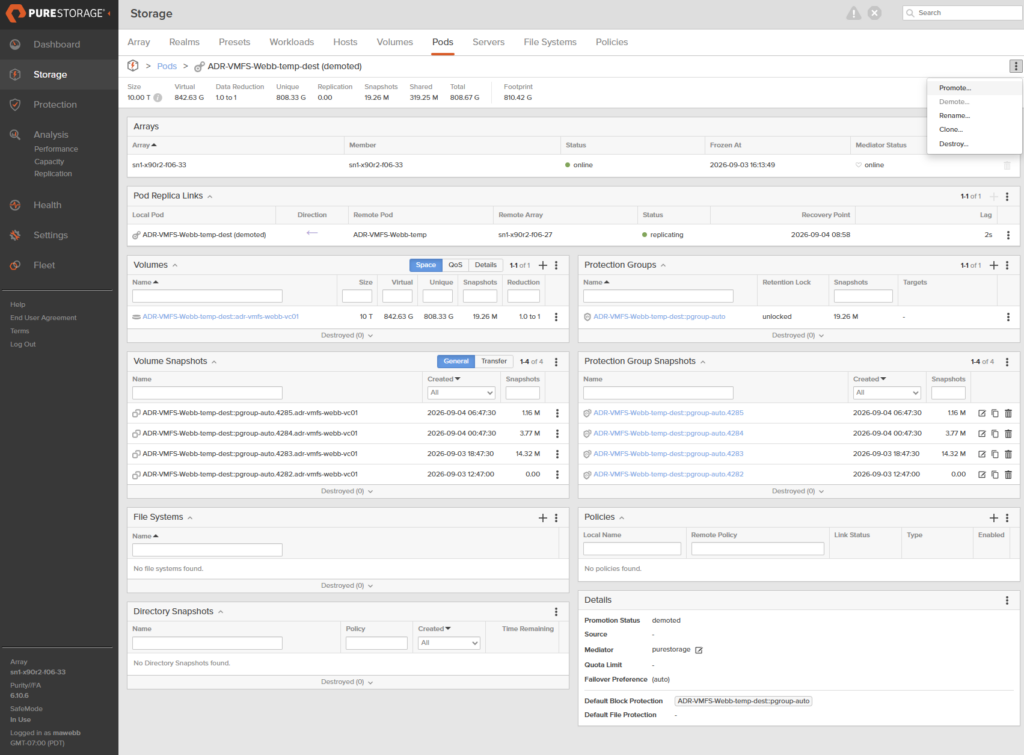
To promote the pod, hit the three dots on upper right and click “promote.”
Step 3: Now Change Some Data (Here Come the Numbers)
With the target sitting promoted, I went back to the four source VMs with AI and started overwriting those 1GiB files with fresh unique generations. Four rounds of 50GiB per VM, so 200GiB of brand new never-before-seen data per round, letting the accounting settle in between.
| Cumulative change on source | Replication space on target | Ratio |
|---|---|---|
| 200 GiB | 185.10 G | 0.926 |
| 400 GiB | 378.76 G | 0.947 |
| 600 GiB | 576.07 G | 0.960 |
| 800 GiB | see footnote |
Nearly one to one, and creeping closer to 1.0 as it went.
Every gigabyte of unique change I made on the promoted-pair source cost me about a gigabyte of Replication space on the target. Which lines up with the warning buried in the best practices guide that I’d read a dozen times and never really absorbed:
If left promoted indefinitely while applications remain running and replicating from the source pod, the target pod could eventually consume replicated capacity equal to the size of the volumes within the pod.
Equal to the size of the volumes. My pod volume is 10T. Left promoted with a busy enough source, this thing will happily eat 10T of my target array and then stop, and every byte of that is capacity I am not using for anything else.
Now, remember what I said about my data being a deliberate worst case. Real workloads compress, they dedupe, and (most importantly) they tend to overwrite the same hot blocks over and over rather than writing fresh unique data every time. A real database doing 800GiB of writes might only produce a fraction of that in brand new unique blocks. So read my 0.93-to-0.96 ratio as the ceiling, not the expectation. Your mileage will be better. Probably a lot better.
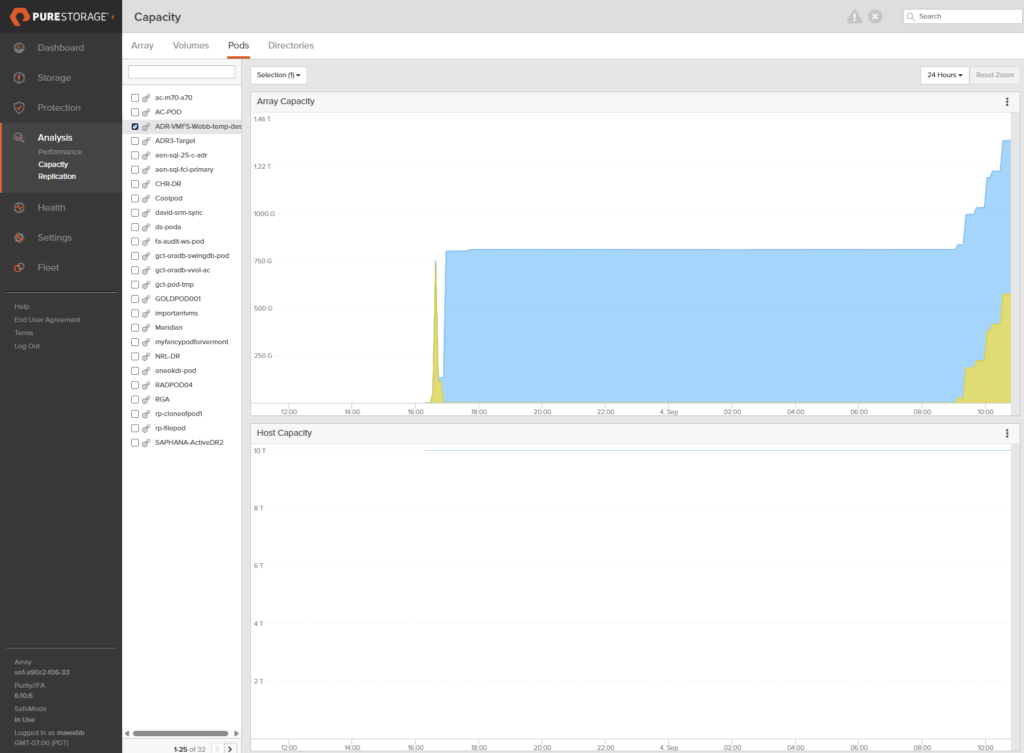
Here we can see the “replication” metric rising from the diff between the promoted pod and incoming replications:
Step 4: Demote, And Watch Nothing Happen
Testing done. Time to demote the target and collect my reward, which per the docs is:
Once the replication target pod is demoted, Replication Space will return to normal levels.
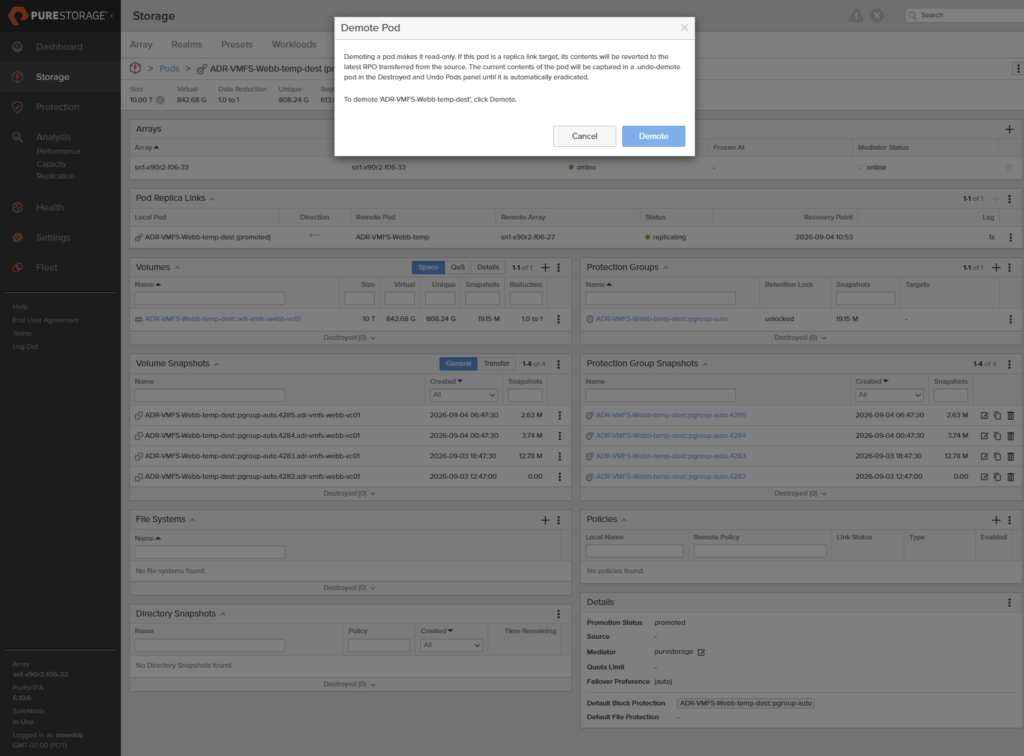
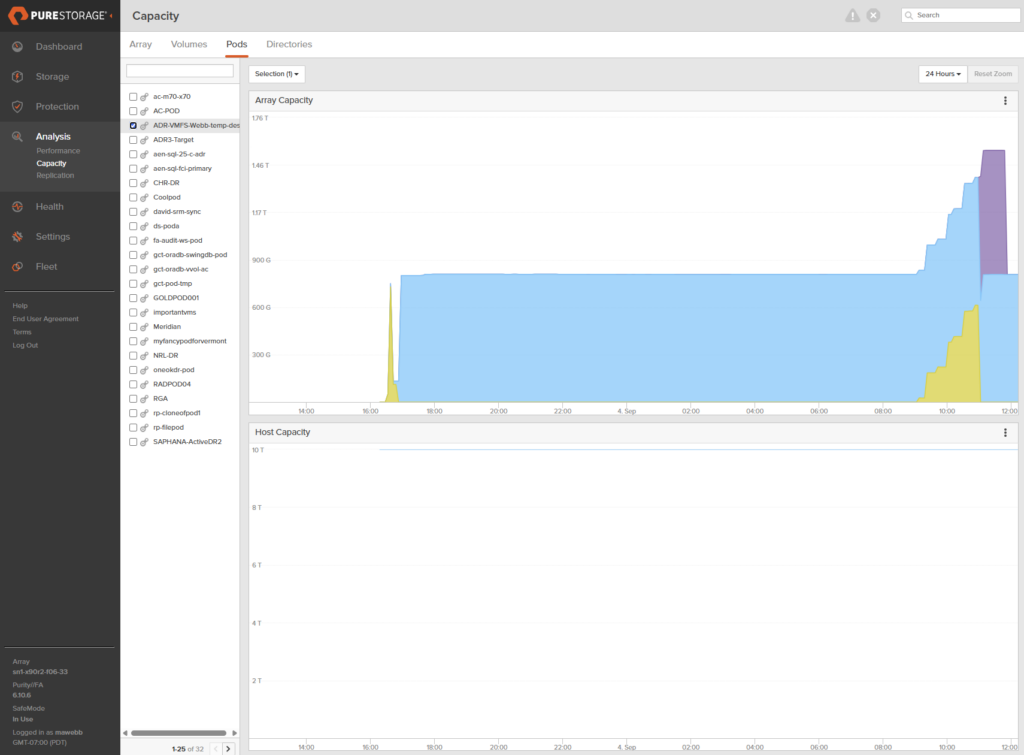
And it did! The Replication number fell off a cliff. It read 611.61G at 10:59, and 0.03G at 11:01. One accounting step, basically instant.
Then I looked at the array total.
| f06-33 | promoted peak | after demote | change |
|---|---|---|---|
| Replication | 613.12 G | 0.03 G | down 613 G |
| Array snapshots | 2696 G | 3478 G | up 782 G |
| Pod snapshots | 0.02 G | 785.44 G | up 785 G |
| Array total used | 17.482 T | 17.496 T | up 14 G. Flat. |
The Replication bucket emptied. The array did not get any emptier. The capacity did not release, it got relabeled. 613G walked out of the Replication column and 782G walked into the Snapshots column, and my total used capacity went up by 14G for its trouble.
This screenshot is my favorite thing to come out of the whole exercise, because you can watch the handoff happen in a single frame. Yellow is Replication climbing through my four rounds. Purple is Snapshots. Watch what happens at about 10:55:
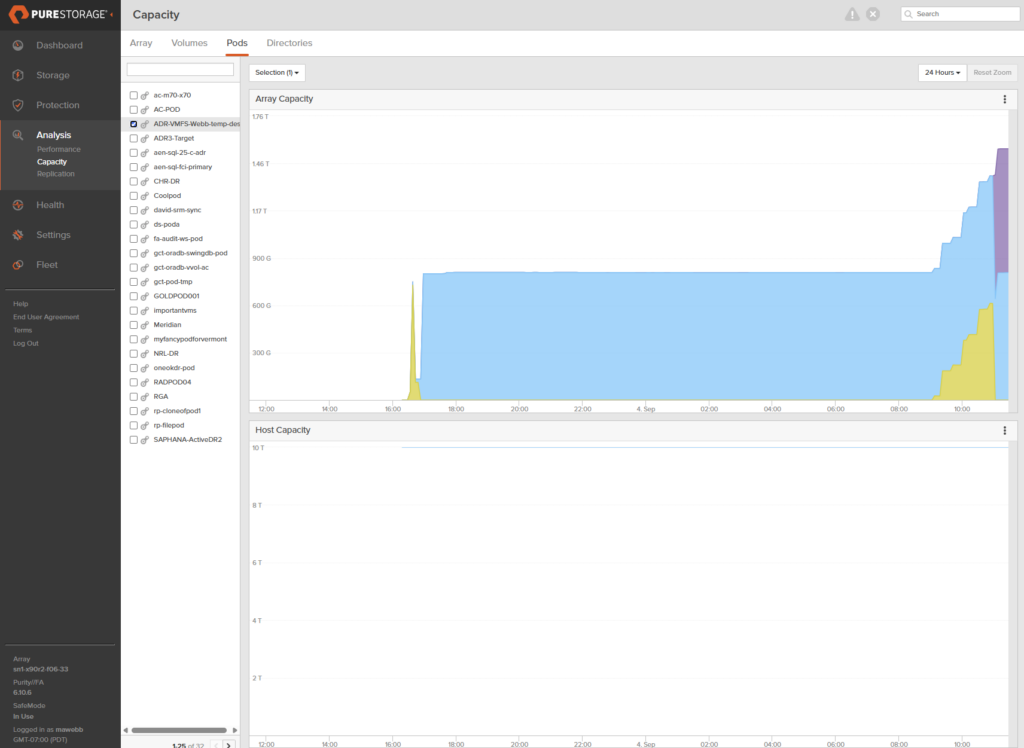
The yellow falls over and the purple stands up in its place.
So what grabbed it?
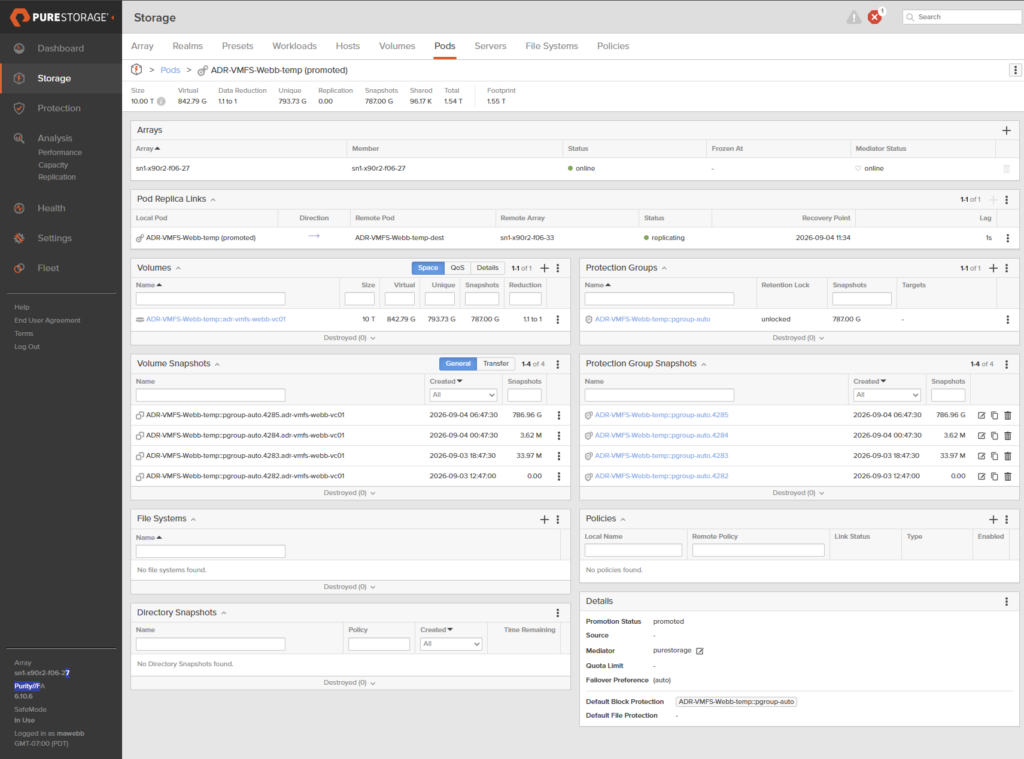
A protection group snapshot I had completely forgotten about. The pod had an auto pgroup (pgroup-auto) running on a 6 hour schedule, and snapshot 4285 had fired at 06:47 that morning, about two hours before I promoted and started rewriting files.
Which means 4285 is holding a pristine copy of every block I subsequently overwrote. All 786.96G of it on the source, and 785.45G on the target (ActiveDR faithfully replicates pgroup snapshots, so it exists on both sides).
The Replication space was never the only thing holding my old data. It was just the thing holding it first.
Step 5: Remove the source snapshots, don’t forget to eradicate them
To remove the snapshots, we have to delete them from the source pod. This is because in an ActiveDR environment, the source of truth is at the pod replicating. If you try to delete the snapshots at the destination, Purity will simply throw an error. So over at our source pod, let’s step through deleting the snapshots.
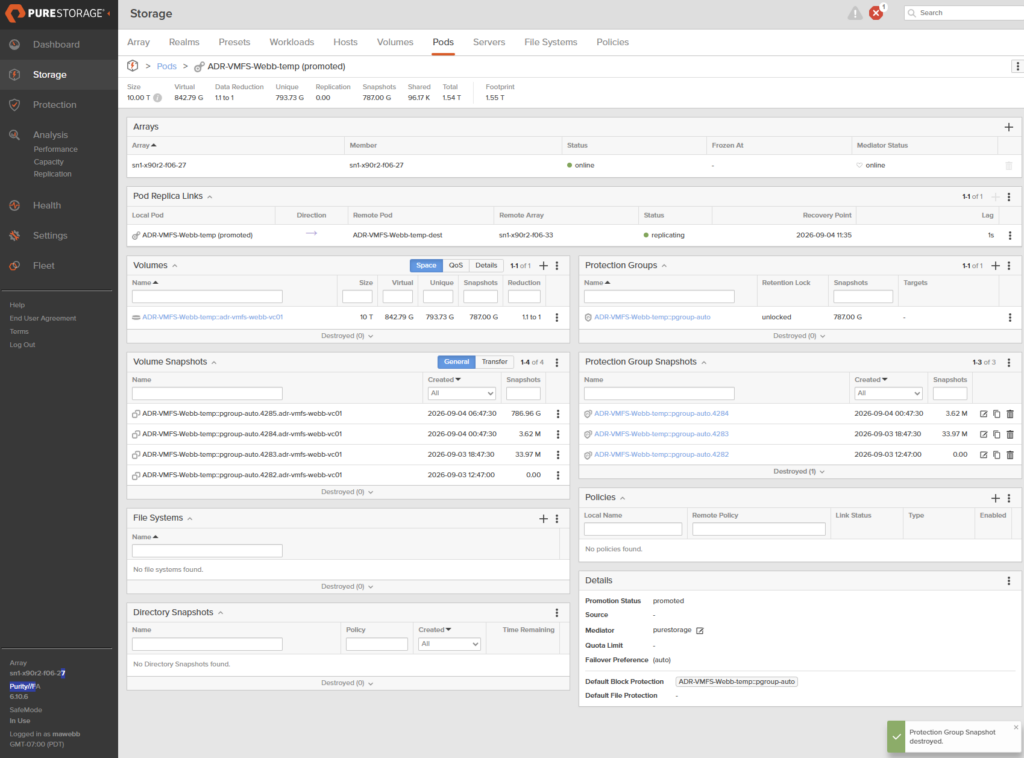
Tip: Destroy is not eradicate: Destroying a snapshot moves it to the recycle bin and it keeps holding every byte until it eradicates. I watched
4284sit in the destroyed bucket still reporting 786.96G with a 168 hour timer on it. If you want the space back today, you have to eradicate deliberately.
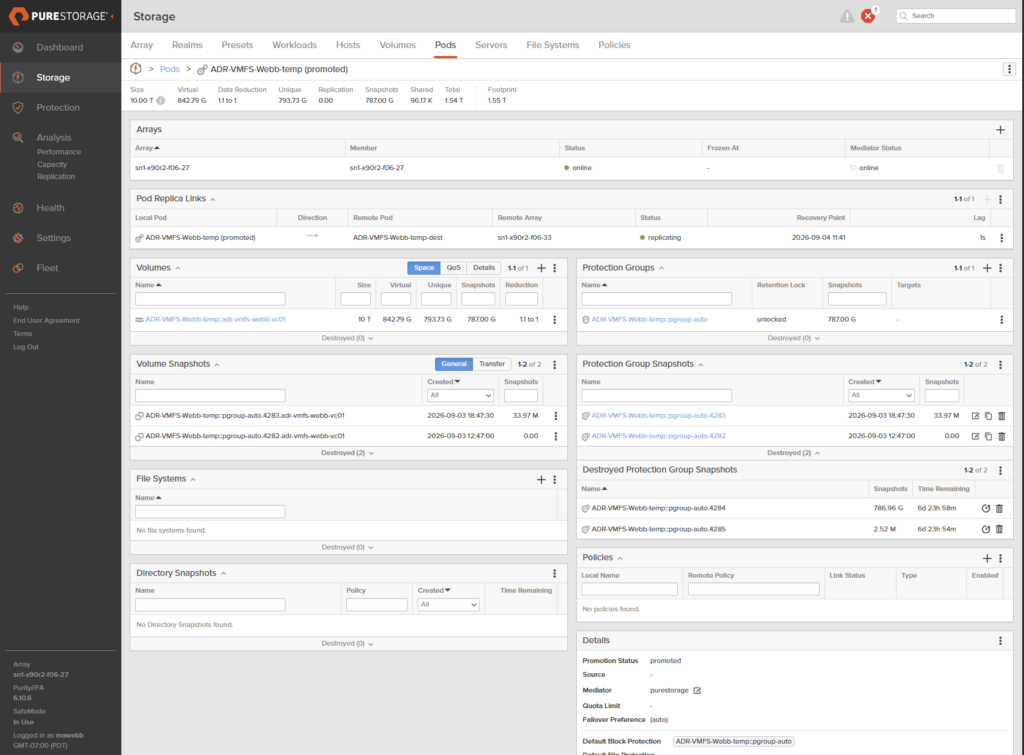
Finally, the kids are un-shrunk, if that’s a thing. Space recovers and we all breath a sigh of relief.
What To Actually Do About It
If you’re staring at a yellow Replication band right now, here’s the order I’d work it:
- Find your promoted target pods. This is the cause the vast majority of the time. Somebody ran a DR test and didn’t demote.
purepod listand look at the promotion status column. - Use pod-level numbers, not array-level. This one saved me. My target array had 29 promoted pods on it from various people’s projects, and array-level Replication is the sum of all of them. The pod object carries its own
replicationfield, and that’s the one that tells you whose space it is. It’s how I proved my 781.95G was my undo pod and not a neighbour’s fire drill. - Demote, then check your total, not just the Replication number. If total used capacity doesn’t move, something else has your old blocks.
- Go look for snapshots inside the pod. Auto pgroup schedules are the sneaky one, since nobody remembers setting them up. Delete them on the source and let the deletion replicate.
- Eradicate, don’t just destroy, or you’re waiting out your snapshot retention. If you have SafeMode enabled you will have to wait or contact support to go through the proper procedure to remove.
- Don’t leave target pods promoted. Everything above is avoidable. Run the fire drill, get your evidence, demote the pod.
Wrap it Up!
The Replication metric is doing exactly what it says. It’s the price of keeping a promoted DR copy and a live production stream true at the same time, it scales with your change rate (call it one-to-one in the worst case and better than that in real life), and it goes away when you demote.
See something you disagree with, or got a promoted pod story? Find me on LinkedIn and let’s talk, I’d love to hear it.
References: