
Intro
Quick one today. I just want to give a current, summer-of-2026 walkthrough for getting the Everpure (Pure Storage) FlashArray management pack installed and reporting into VCF Operations, because the steps have drifted a bit and half the screenshots floating around out there are for a product that has been renamed twice since they were taken.
And that is the running joke of this post. If you deployed this thing three times over the last five years you installed it into vRealize Operations, then into Aria Operations, then into VCF Operations, and it was the same product the entire time. So if I slip and call it vROps, or Aria, or VCF Ops interchangeably below, just know I’m doing it on purpose (mostly). Everpure went through a name change too, so honestly we’re all just doing our best out here.
Goal for the day: download the pack, install it into vRealize (see, I did it again) Operations, point it at a FlashArray, and then have a little fun with the dashboards that ship with it.
What You’ll Need
- VCF Operations 9.x up and running (screens here are 9.1).
- Admin rights to add a management pack and create an adapter account.
- A FlashArray reachable from the VCF Ops node over HTTPS.
- A read-only array user or API token. The pack only reads, so give it the least privilege you can (I use a local
pure_roaccount with the Read Only role).
Step 1: Download the Pack
The management pack is a .pak file and it’s license free. Grab it from the Everpure support site on the VCF Operations release timeline page: https://support.everpuredata.com/r/release-notes-for-vmware-solutions/release-timeline-22
That page lists every released version, the download link, the MD5/SHA256 checksums, and (the part people skip) which Purity and VCF Operations versions each build actually supports. Match the build to your VCF Ops version before you download, future you will be grateful.
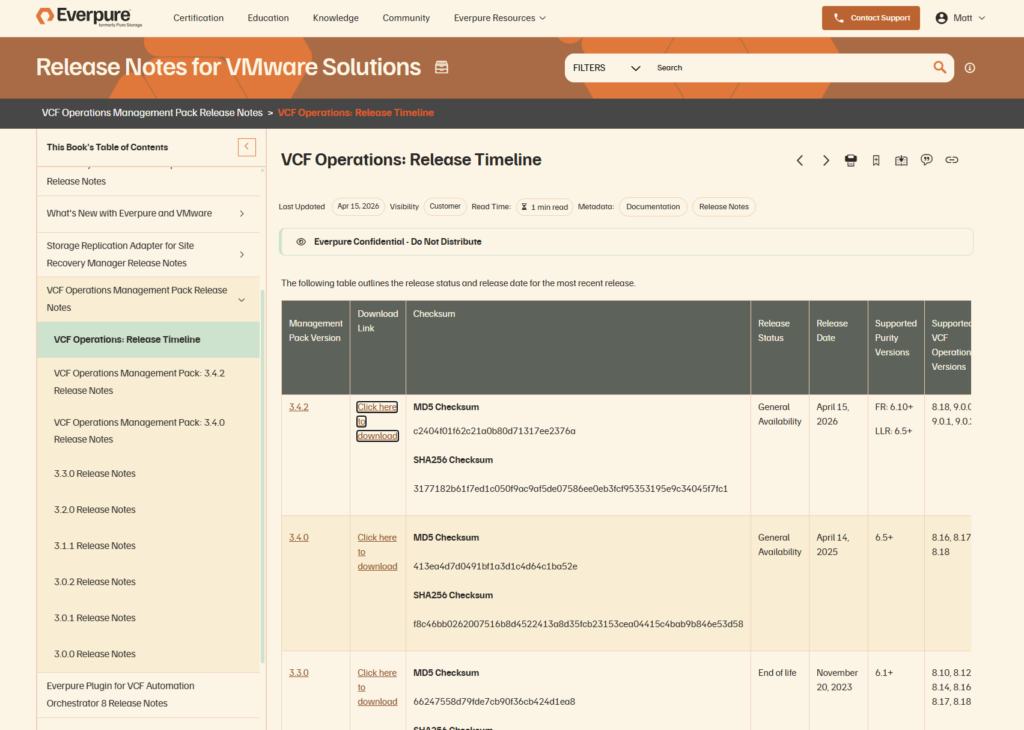
Tip: Verify the checksum: the page publishes MD5 and SHA256 for a reason. On Windows,
Get-FileHash .\PureStorageAdapter-<version>.pak -Algorithm SHA256and compare. Two seconds now beats debugging a corrupted upload later.
Step 2: Install the .pak
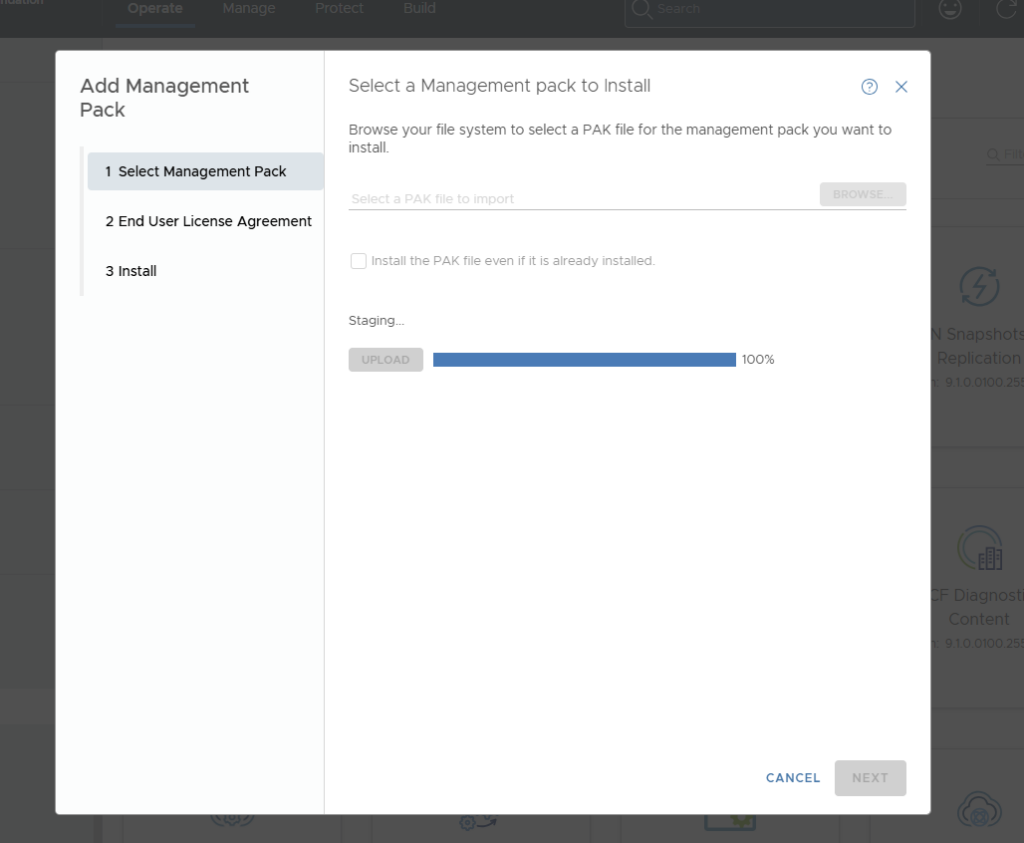
In VCF Operations, head to Administration > Integrations, click over to the Repository tab, and hit Add. Browse to your .pak, click Upload, and watch the staging bar march to 100%.
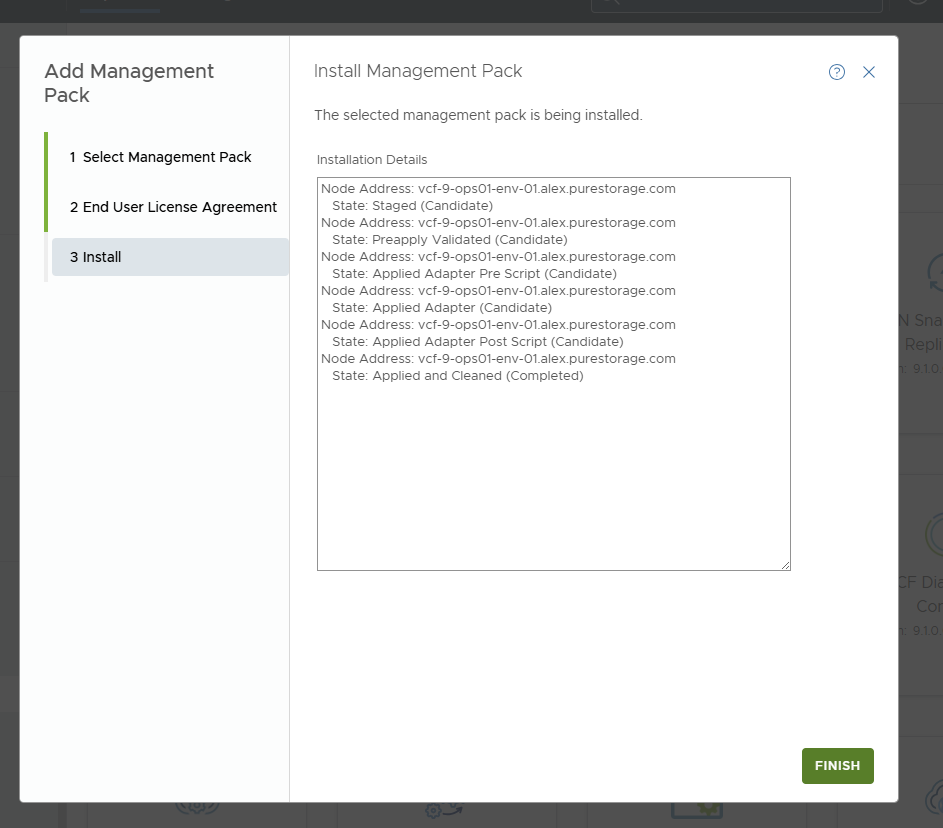
Click Next, accept the EULA, and let it install. You’ll see it step through the node states (Staged, Preapply Validated, a couple of adapter scripts) and land on Applied and Cleaned (Completed). Click Finish.
Step 3: Add Your FlashArray
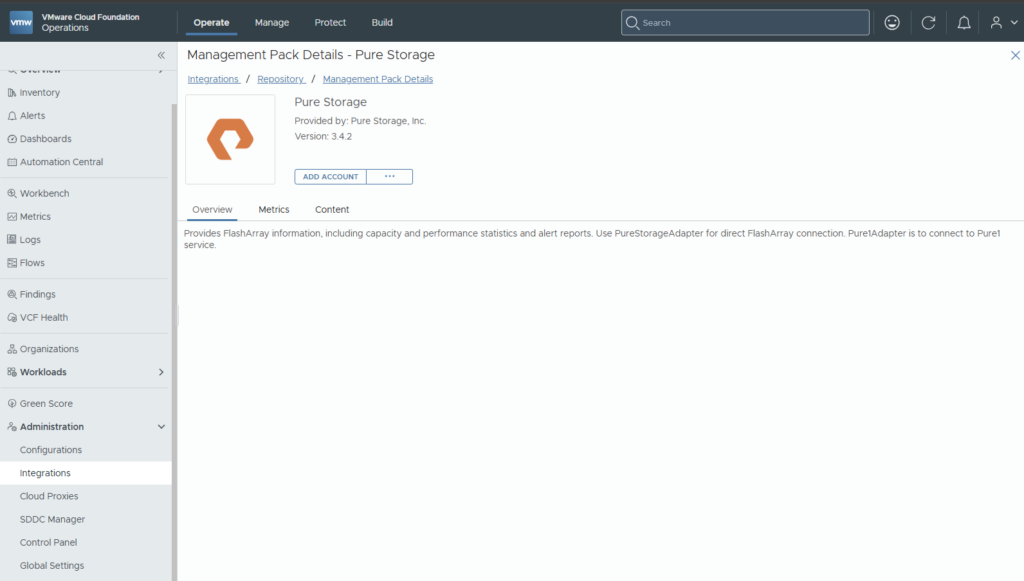
Installed, you land on the Management Pack Details page for Pure Storage. Worth noting there are actually two adapters in here: PureStorageAdapter talks directly to a FlashArray, and Pure1Adapter pulls from the Pure1 cloud service. We want the direct one. Click Add Account.
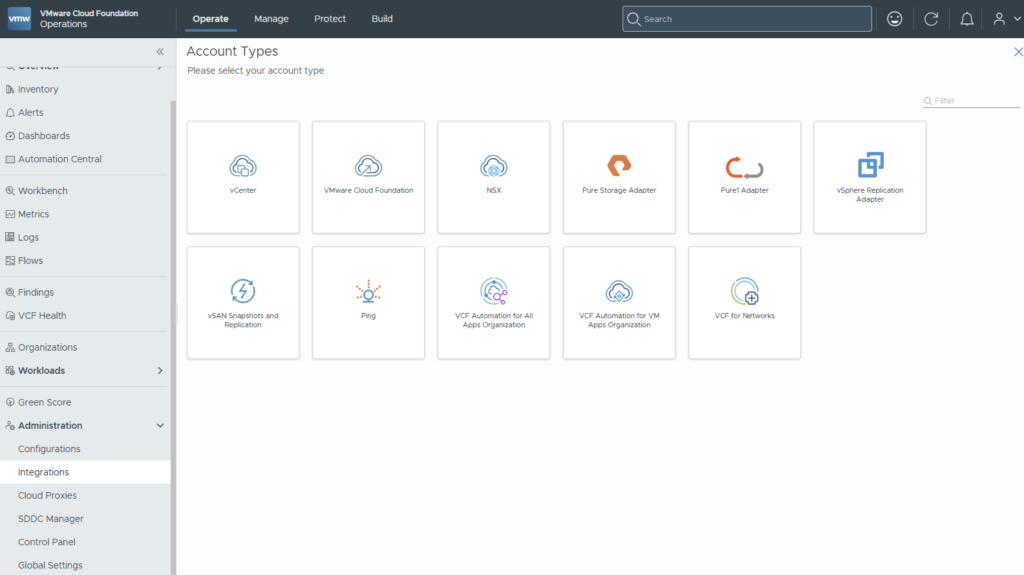
Pick Pure Storage Adapter from the account types.
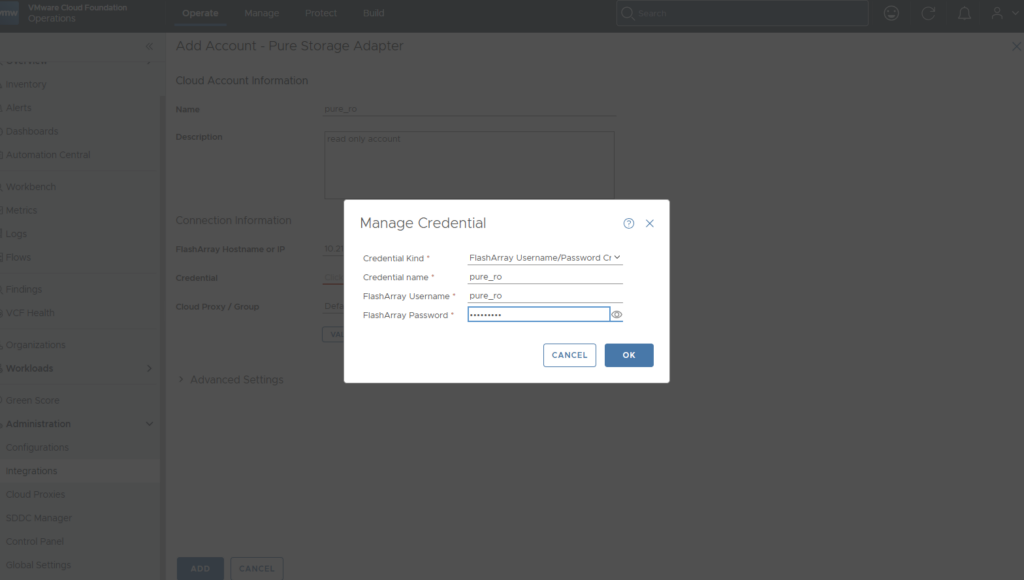
Then fill in the account: a name, the FlashArray hostname or IP, and a credential. In the credential dialog set the kind to FlashArray Username/Password Credential (or use an API token if you prefer), and drop in your read-only user. Hit Validate before you save, if it fails it’s almost always either the node can’t reach the array’s management IP or a typo in the credential. Fix it here, not later when you’re wondering why nothing is showing up.
Give it a collection cycle or two (a few minutes) and your array, volumes, and hosts start populating. One thing worth calling out from my own environment: the pack only maps FlashArray block datastores (VMFS and vVol) to volume objects, and it only reports on arrays you’ve actually added to the account. If an array isn’t in the reporting list, its datastores won’t light up the volume side of things (ask me how I know).
The Dashboards That Come With It
The pack ships its own dashboards. Search “Pure” in Dashboards and you’ll find a FlashArray Dashboards folder with a couple of ready-made ones, Pure Environment (a health and alerts overview) and Pure Hosted VMs.
Pure Hosted VMs is the fun one: It’s a Virtual Machine list wired to a set of widgets to the right (a VM metric chart, a Related Datastore panel, and a datastore metric chart). Click any VM and the whole board cascades to that VM: its metrics, the datastore backing it, and that datastore’s performance.
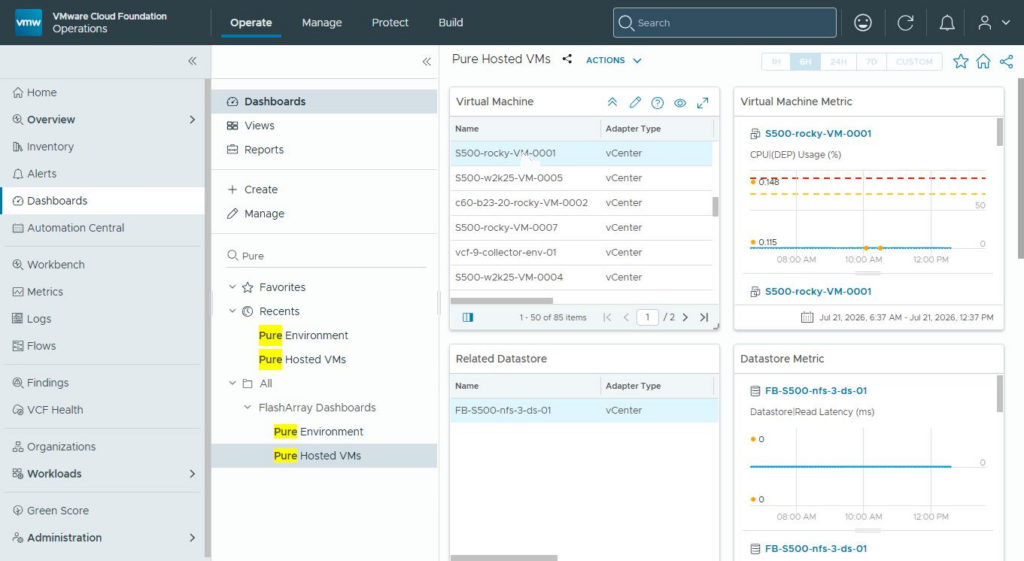
That click-to-cascade is VCF Ops widget interactions doing the work (one widget is the provider, the rest receive its selection).
Cloning It and Adding a VM Heatmap
The stock dashboard is great, but you’ll usually want your own copy to tweak. Don’t build from a blank canvas, clone the one that’s already 80 percent there. Go to Dashboards > Manage, filter for Pure Hosted VMs, open the row menu, and choose Clone. Rename your copy (I called mine FlashArray VM Analytics) and open it in the editor. Editing the clone never touches the original.
From here I added one widget I really wanted: a Heatmap of my VMs so the storage-busy ones surface at a glance. In the heatmap’s Output Data config I set the object type to Virtual Machine, sized the tiles by Virtual Disk Total IOPS (so the busiest VMs are the biggest boxes), and colored them by Virtual Disk Total Latency, green under 5ms, yellow through the middle, red at 15ms and up. I dropped it in double-wide across the top.
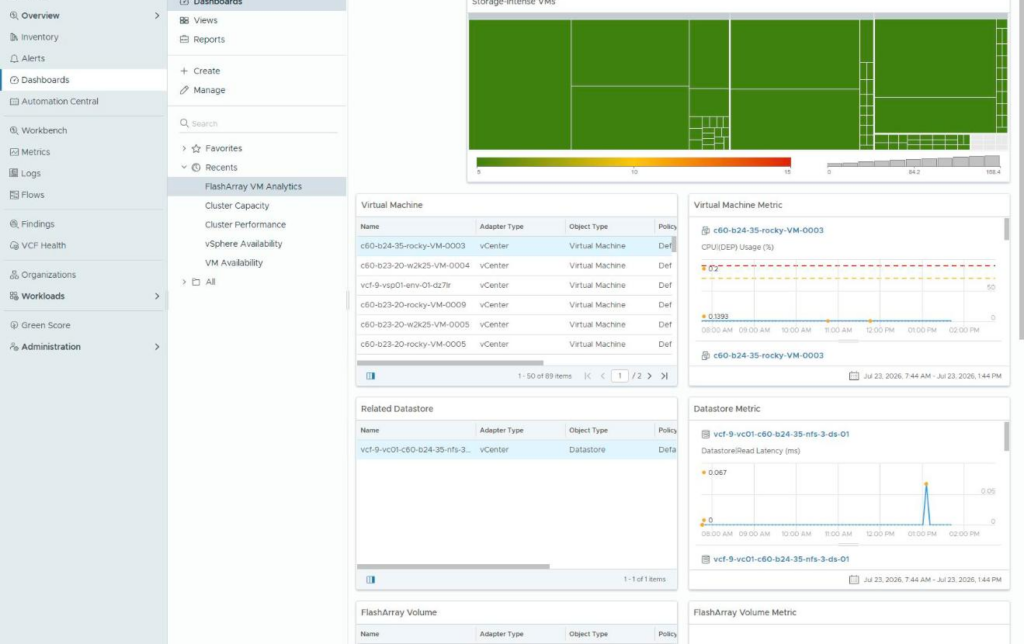
Last touch: wire the heatmap into the chain so it drives the topology too. Flip on Interaction Mode in the editor, then draw a link from the heatmap’s outgoing connector to the Related Datastore widget. Now clicking a hot tile re-scopes the whole board to that VM, same as the VM list does, except now you’re clicking the loudest VM on the array instead of scrolling a table.
Tip: Size and color take one metric each: if you ever want a blended “intensity” number (say read plus write IOPS plus throughput all in one), that’s a Super Metric, not something the heatmap can add up on its own. For most people, Total IOPS for size and Total Latency for color is plenty.
If you would like to use this dashboard for a VCF Ops 9.1 instance, you can import the JSON here: https://github.com/MatthewwVM/favcfopsdash/blob/main/dashboard.json
Wrap Up
That’s the whole thing: grab the .pak off the Everpure release page, install it through Integrations, point it at a read-only array account, and then lean on the built-in dashboards before you go building your own. The clone-and-tweak path (plus a VM heatmap and a little interaction wiring) gets you a genuinely useful “which VM is beating up my array” view in about ten minutes.
Like everything in this space, the exact menu names will probably change by the time you read this (and the product might have a fourth name). See something that’s moved, or have a slicker way to build the dashboard? Find me on LinkedIn and let’s talk, I’d love to hear it.