Benchmarking for Proof of Concepts
Hyper-Converged Infrastructure (HCI) remains one of the fastest-growing segments in IT. According to IDC’s latest release, HCI grew at 17.2% year over year and is now a 2.3 billion dollar business. Compare that to the external OEM storage market from IDC with a decline of 0.1%. I’ve been in pre-sales engineering roles covering HCI since 2017, starting with VMware and now at Dell|EMC. Due to the varying storage needs of customers, I certainly would not say that HCI would fit every need out there. But there is no denying that HCI offers significant value customers are looking for, which is why we continue to see evaluations for a refresh or net-new infrastructure purchases.
Even though the technology is not new (vSAN, for example, went GA in 2014,) many technology professionals need to prove the technology either to themselves or to their peers through some sort of Proof of Concept (PoC.) There are many industry-standard benchmarking tools out there. Early in my career, I used IOmeter (http://www.iometer.org/) or FIO (https://fio.readthedocs.io/en/latest/index.html) often. But with any large architectural shift, which HCI is, old tools don’t always translate. I have had several instances where customers would be disappointed after running something like crystal disk mark (I guess a lot of people always go to this because they use this to test their consumer gaming rigs? This isn’t the best tool to test enterprise storage systems.) The reason why these tools don’t translate is that HCI was not built for one single virtual machine or vDisk performance but many virtual machines performing at scale! There needed to be a tool that would automate the creation of testing machines and also kick off benchmarking tools in sync. That’s where HCIBench comes in!
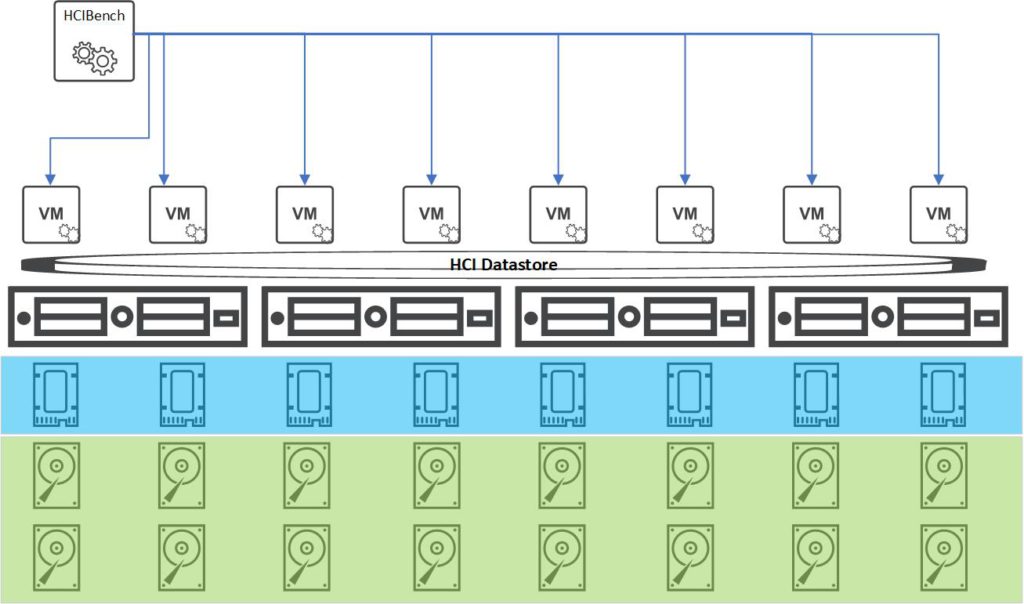
HCIBench is a fling made by VMware to do exactly that. It is a virtual appliance with a web interface that deploys multiple virtual machines with many virtual disks, installs and configures a benchmarking tool, and initiates the benchmarking across all the virtual machines in unison. What’s cool about this tool is that it allows for both an administrator that is not super storage savvy and an advanced storage engineer that wants very specific IO patterns. In this post, I will go over out to install, configure, run, and review results.
Download and Deploy the OVA
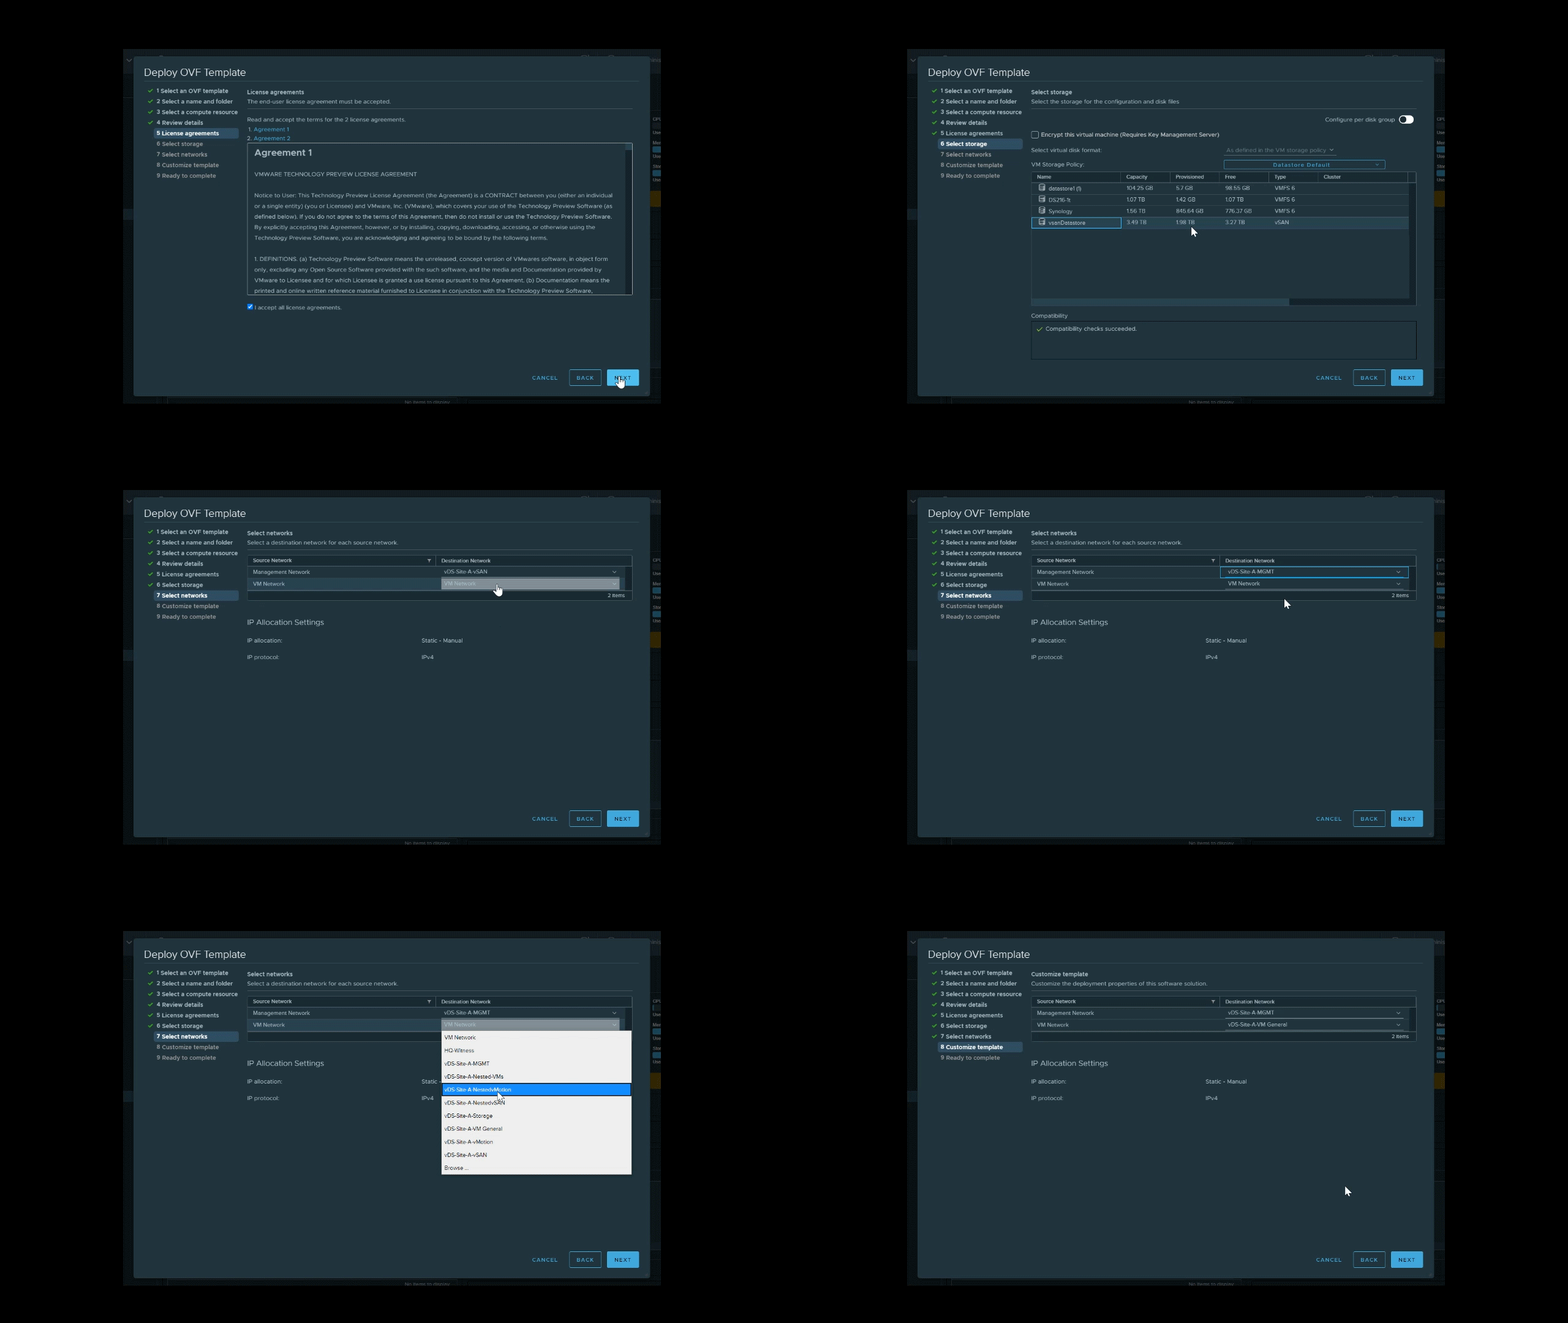
First, we need to start by grabbing the OVA file from VMware’s flings site. I downloaded 2.4.0 recently and it was about 1.3 GB. Now we need to deploy the virtual appliance into our HCI cluster. Log in to your vCenter Server and right-click on your cluster your want to deploy on. Select “Deploy OVF Template..” Upload the .ova file you just downloaded from the flings site. Deploying the appliance is fairly standard, but it is worth pointing out the network. When you deploy HCIBench it will come with two NIC’s. One will face the network where the test VM’s will be deployed. Usually, you will have DHCP on this network, however, this is not mandatory as the appliance can configure IPs for each of the test VM’s. The other NIC will face the management network where the appliance needs to be able to reach your ESXi management interfaces and vCenter to work. Also note, that you do not have to deploy it on the datastore of the HCI (or other storage product) you would like to test. That will be selected when we configure our HCIBench run.
Once the appliance is deployed, power it up. To connect to the web interface, you will need to go to https://<ip or hostname>:8443 and log in with the credentials you made during your ova deployment. You will get a landing page that will have a list of environment details you need to fill out. Fill out all the required fields, the ones worth calling out here is to ensure you select the right datastore you want to test and the network you want the test VM’s to use. If you do not specify the network, it will use the default “VM Network” which may or may not be available depending on how you configured your cluster. To get started, I recommend doing an “Easy Run” first. When you check the “Easy Run” radio button, there are 4 standard tests that are selected. These are going to be general tests that a lot of people like to see. This is are also good starting points if you are not deeply familiar with storage I/O or if you just want to get a general understanding of the capability of your HCI solution.
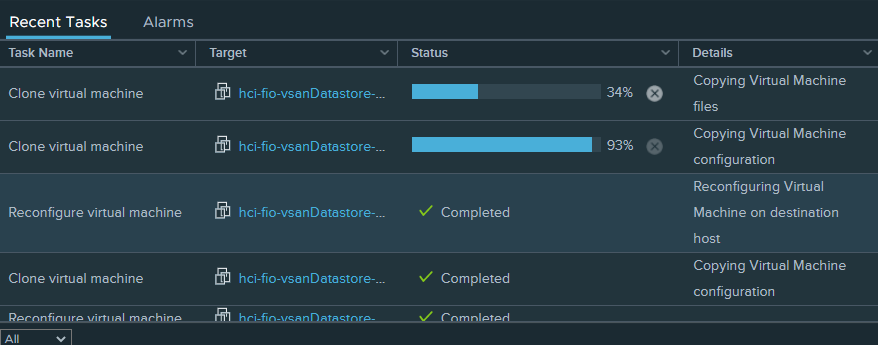
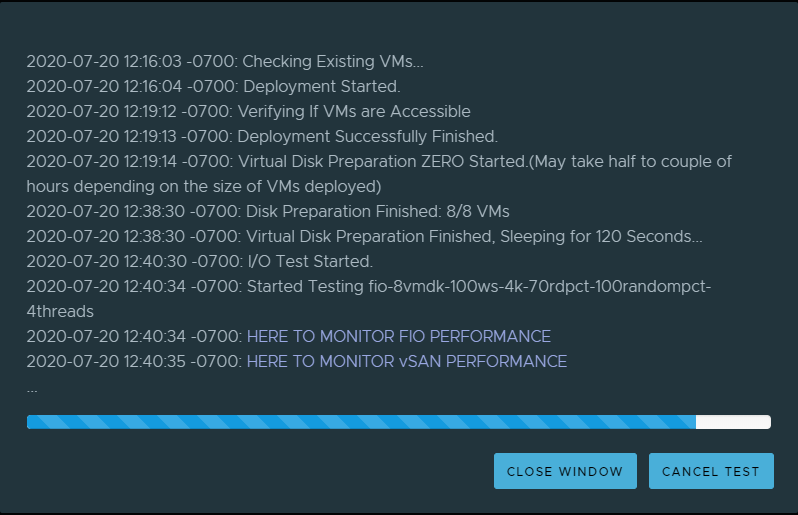
Once the test has been validated and kicked off, HCIBench will start creating the test VM’s. Depending on the size and cluster configuration, this could take some time to load these virtual machines and data into the virtual disks. The progress bar will tell you how many disks it has prepared and how many it has left to prepare. Once the virtual disks are prepared, I/O will be generated and we can start monitoring performance live. Keep in mind, you don’t have to capture or monitor it live as HCIBench will generate a report with the test is completed. For this post, I’m running HCIBench on a relatively limited vSAN cluster in my lab. So I can watch the real-time results either by the Graphana graphs or by logging into the vSphere WebClient and going to cluster>monitor>vSAN>performance screen.
Advanced Parameters
As I had mentioned earlier, one of the coolest aspects of HCIBench is that its geared towards newer people to storage performance testing and the seasoned storage professional. Easy Run allows you to run one or all of a standard 4 parameters. Each is intended to show different aspects of storage performance like maximum IOPS or maximum throughput. But for the more seasoned storage professional, it may be necessary to customize your own set of parameters based on what you know about your applications. If you don’t know the I/O profiles of your environment, you could run Live Optics to determine a set of parameters you could run.
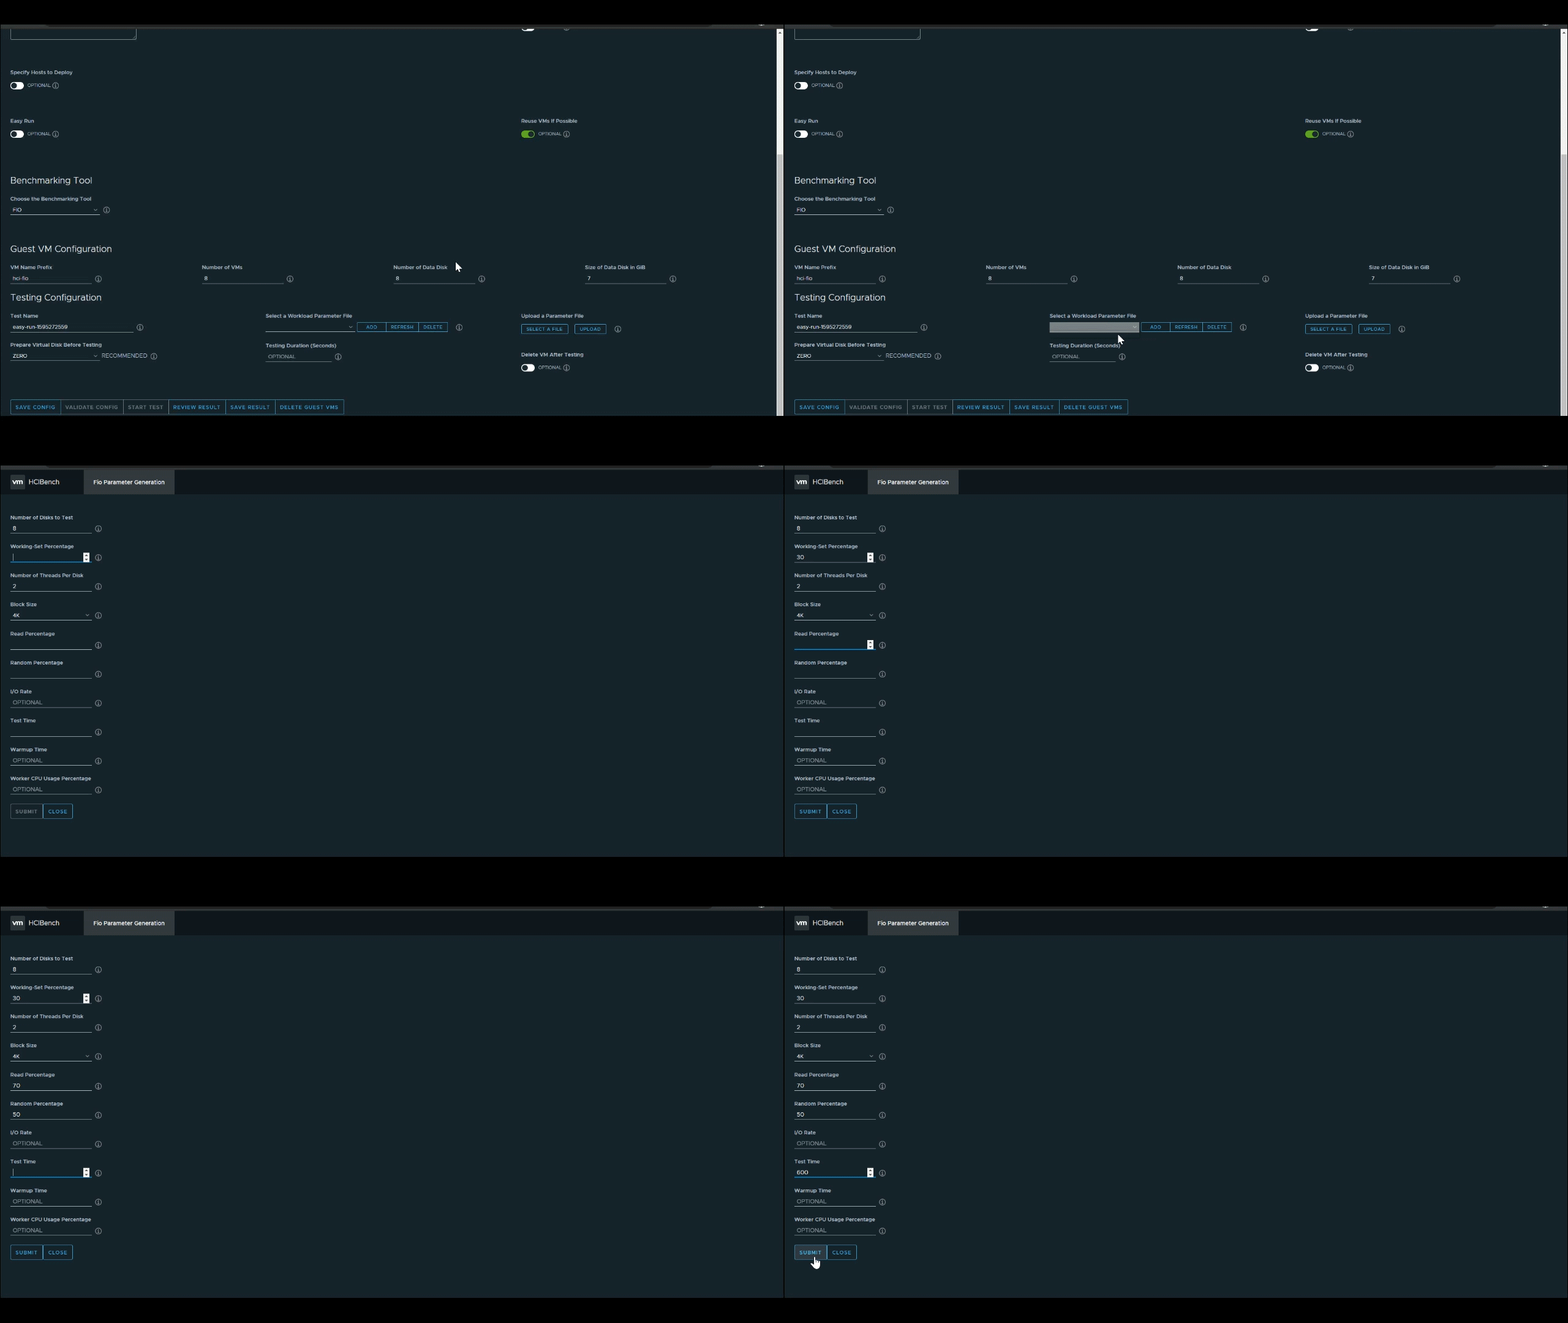
To make a parameter file, click the “Add” button by “Select a Workload Parameter File” section. This will open a new window where you can configure the parameters such as block size, working set, read/write ratio, and test time. Fill out your parameters and click “Submit.” Now head back to your HCIBench Configuration Page and click “Refresh” that was next to the “Add” button to see the parameter you just made. You are now ready to start your custom run.
Reviewing Results
Once you have completed a run. You provided multiple files with the results. To view these files, go to your HCIBench Configuration Page and click on “Results.” This will forward you to a directory structure. There are 3 main files we will look for, each shown by your run number. A simplified results pdf is created in your run folder in a format similar to the following: fio-8vmdk-100ws-4k-70rdpct-100randompct-4threads-1595274034-report.pdf. This aggregates the results of the test and takes graphs from Graphana for some visual representation of the results. There is also a .txt file with an output of the IOPS, throughput, latency, and CPU usage. One of my favorite outputs is the xlxs output. This will export the IOPS, throughput, and latency statistics for each polling interval. This allows you to create your own graphs using excel.
Wrap Up!
Hyper-Converged Infrastructure is growing at a rapid pace. With the adoption of this new architecture, new ways of testing are necessary. Once you and your organization have put together what your success criteria are for your next generation of infrastructure, HCIBench can help you prove that an HCIBench solution could meet your needs.